Field of Research
Health Economics, Development Economics
Research Topic
Health Economics, Development Economics
Overview of Research
Our behaviors and attitudes can be affected by our classmates, friends, and acquaintances, which is referred to as peer effects in economics. Particularly, peer effects on consumption refer to the consumption response towards their peers’ consumption behaviors. For example, we may consider buying an iPad after observing our friends do so.
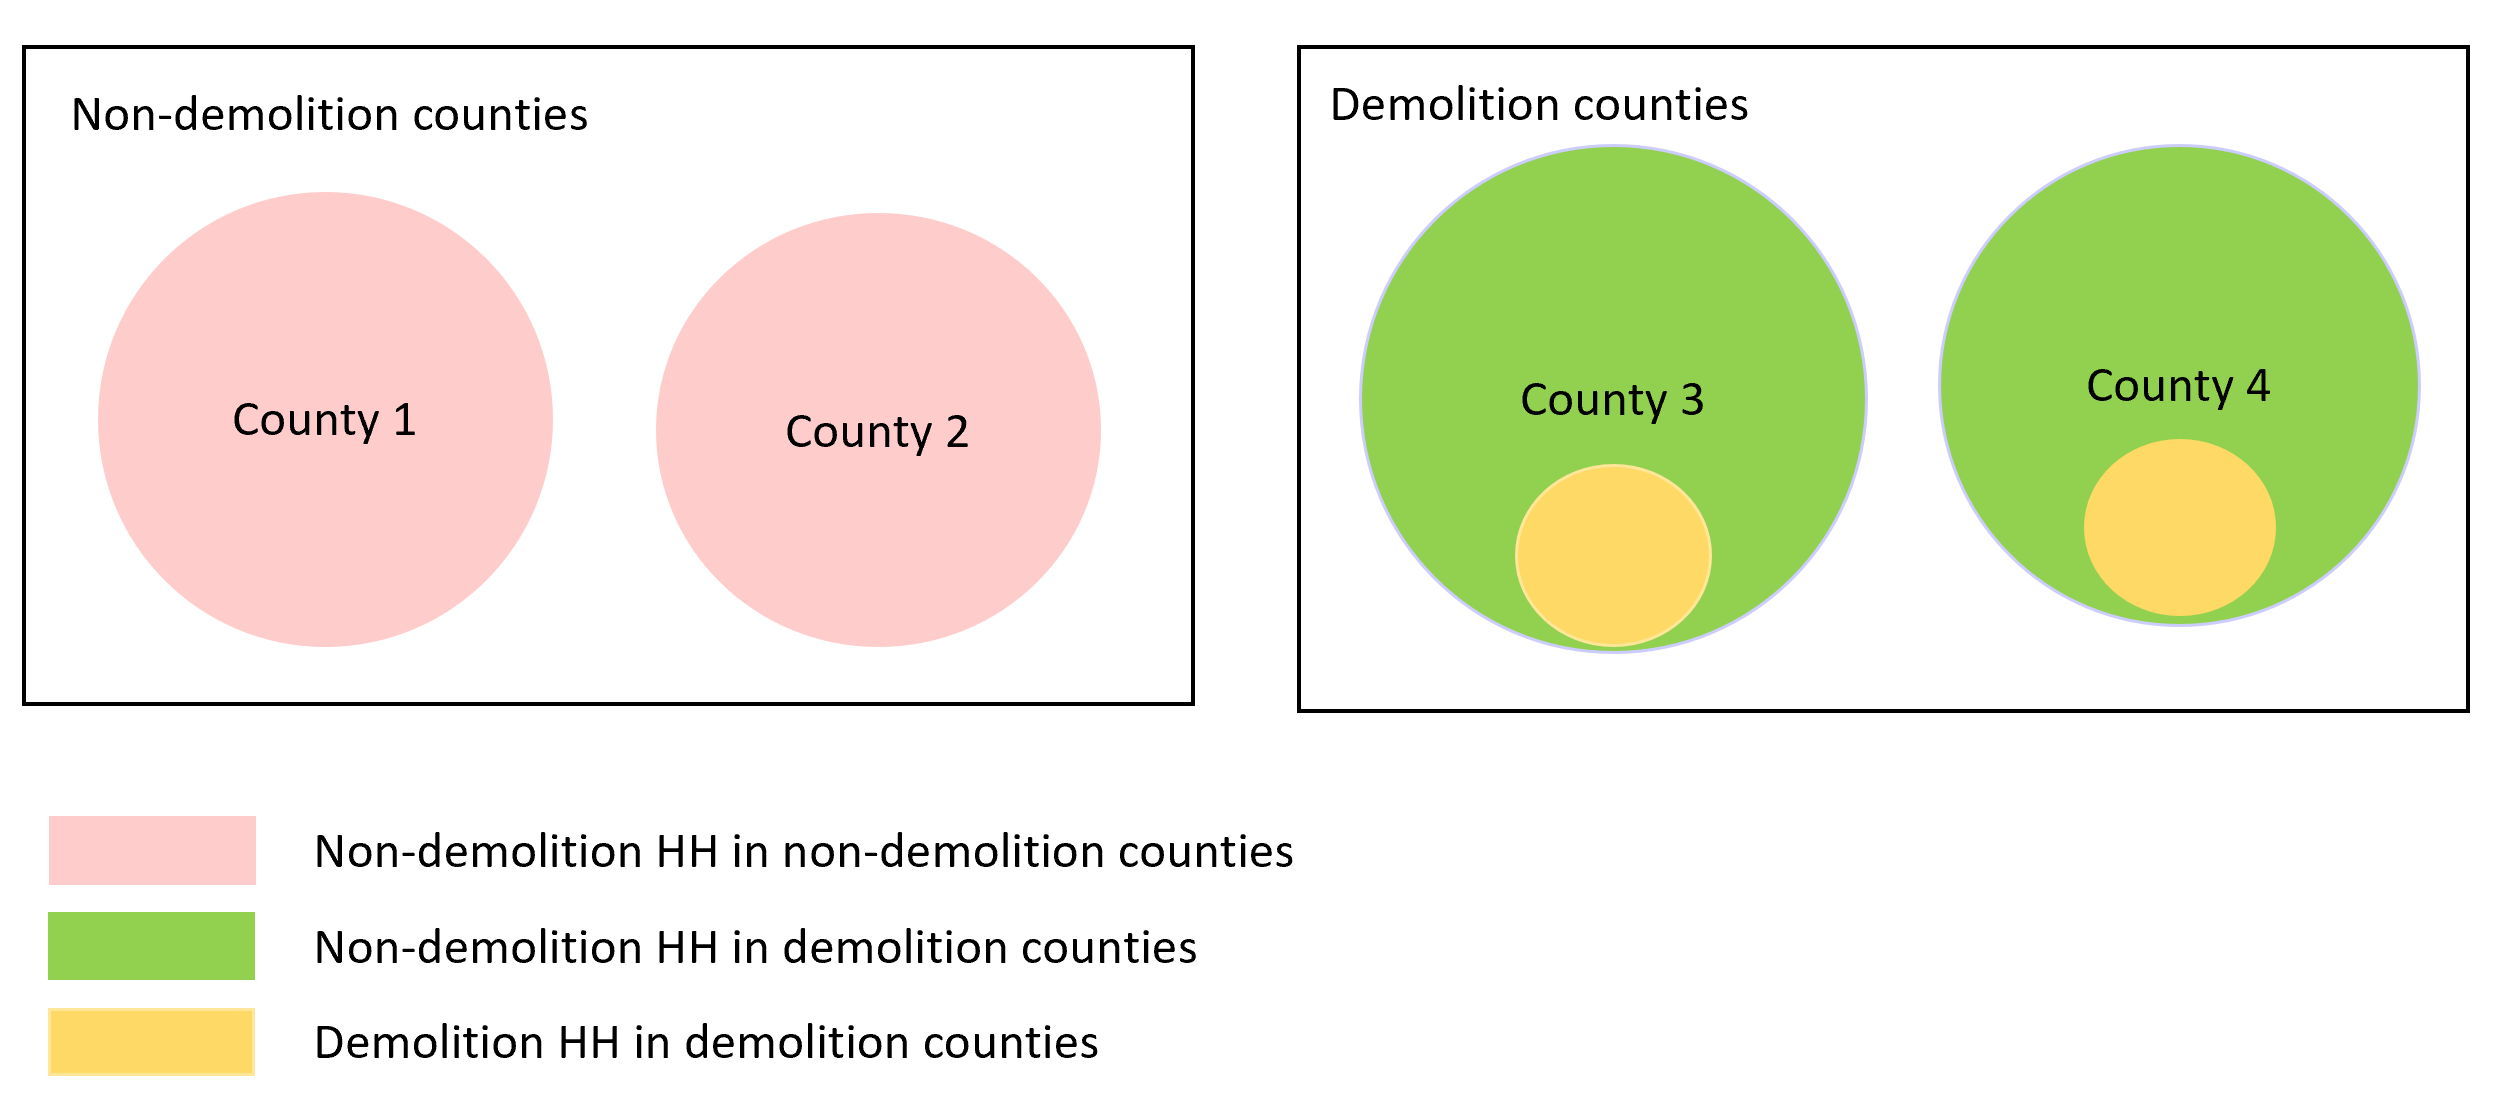
One of my studies examines the peer effects on consumption utilizing the urban housing demolition (UHD) in China. Due to the needs of urbanization and development, massive old buildings are demolished in China. UHD is decided by the government, and households cannot predict it. Households chosen to be demolished can receive substantial monetary compensation—the average compensation in my data is 908,918 RMB ($132,221), whereas the per capita disposable income was 21,966 RMB ($3,195) in 2015. Therefore, after receiving this huge amount of unexpected wealth, we can see that demolition households have significantly increased their consumption. This provides a favorable situation to examine peer effects on consumption. Suppose there are no peer effects: non-demolition households in demolition counties (green) should have similar consumption as non-demolition households in non-demolition counties (pink). On the other hand, if there are peer effects such that green households have been affected by the demolition households (yellow) and have increased their consumption, then we should observe a difference in the consumption of green and pink households.

I employ the instrument variable (IV) methodology, and the results show non-negligible and statistically significant peer effects. The elasticity of household annual consumption with respect to peers’ consumption is around 0.233 to 0.292. That is, a 10% increase in the average annual consumption growth of demolition households (yellow) increases their peers’ (green) annual consumption growth by 2.33%–2.92%. Furthermore, we run a placebo test where we randomly reassign placebo peers to the households and repeat it 1000 times. Figure 2 shows the distribution of placebo coefficients. The black dashed lines locate the upper 95% point of the distributions, and the red bold lines locate the estimated peer effects. The bold red lines are on the far-right side of the distributions and distinct from the estimates based on placebo counties, supporting that our baseline results are not due to chance but are due to peer effects.

These effects are more prominent in counties with a higher proportion of demolition. The findings also imply positive and significant externalities of the ongoing large-scale urban housing demolition on consumption.
SHEN, Yanni
Assistant Professor
Degree: Ph.D. in International Public Policy (Osaka University)
yan-shen@osipp.osaka-u.ac.jp


